Case Study: Financial Dashboard for Fortune 500 Company
At FirstLedger Web App Data Visualization Development Studio, we recently had the opportunity to develop a comprehensive financial dashboard for a leading Fortune 500 company. This case study explores how our expertise in web data visualization development and data dashboard development significantly improved the client's decision-making processes.
The Challenge
Our client, a global leader in their industry, was struggling with disparate financial data sources and a lack of real-time insights. They needed a centralized solution that could provide up-to-the-minute financial analytics, enabling faster and more informed decision-making across their organization.
Our Approach
Leveraging our extensive experience in web app data development, we embarked on a collaborative journey with the client to create a tailored financial dashboard. Our approach included:
- Conducting in-depth stakeholder interviews to understand specific needs and pain points
- Analyzing existing data structures and integrating multiple data sources
- Designing an intuitive user interface that prioritizes key financial metrics
- Implementing advanced data visualization techniques to represent complex financial data
- Ensuring real-time data updates and cross-platform accessibility
The Solution
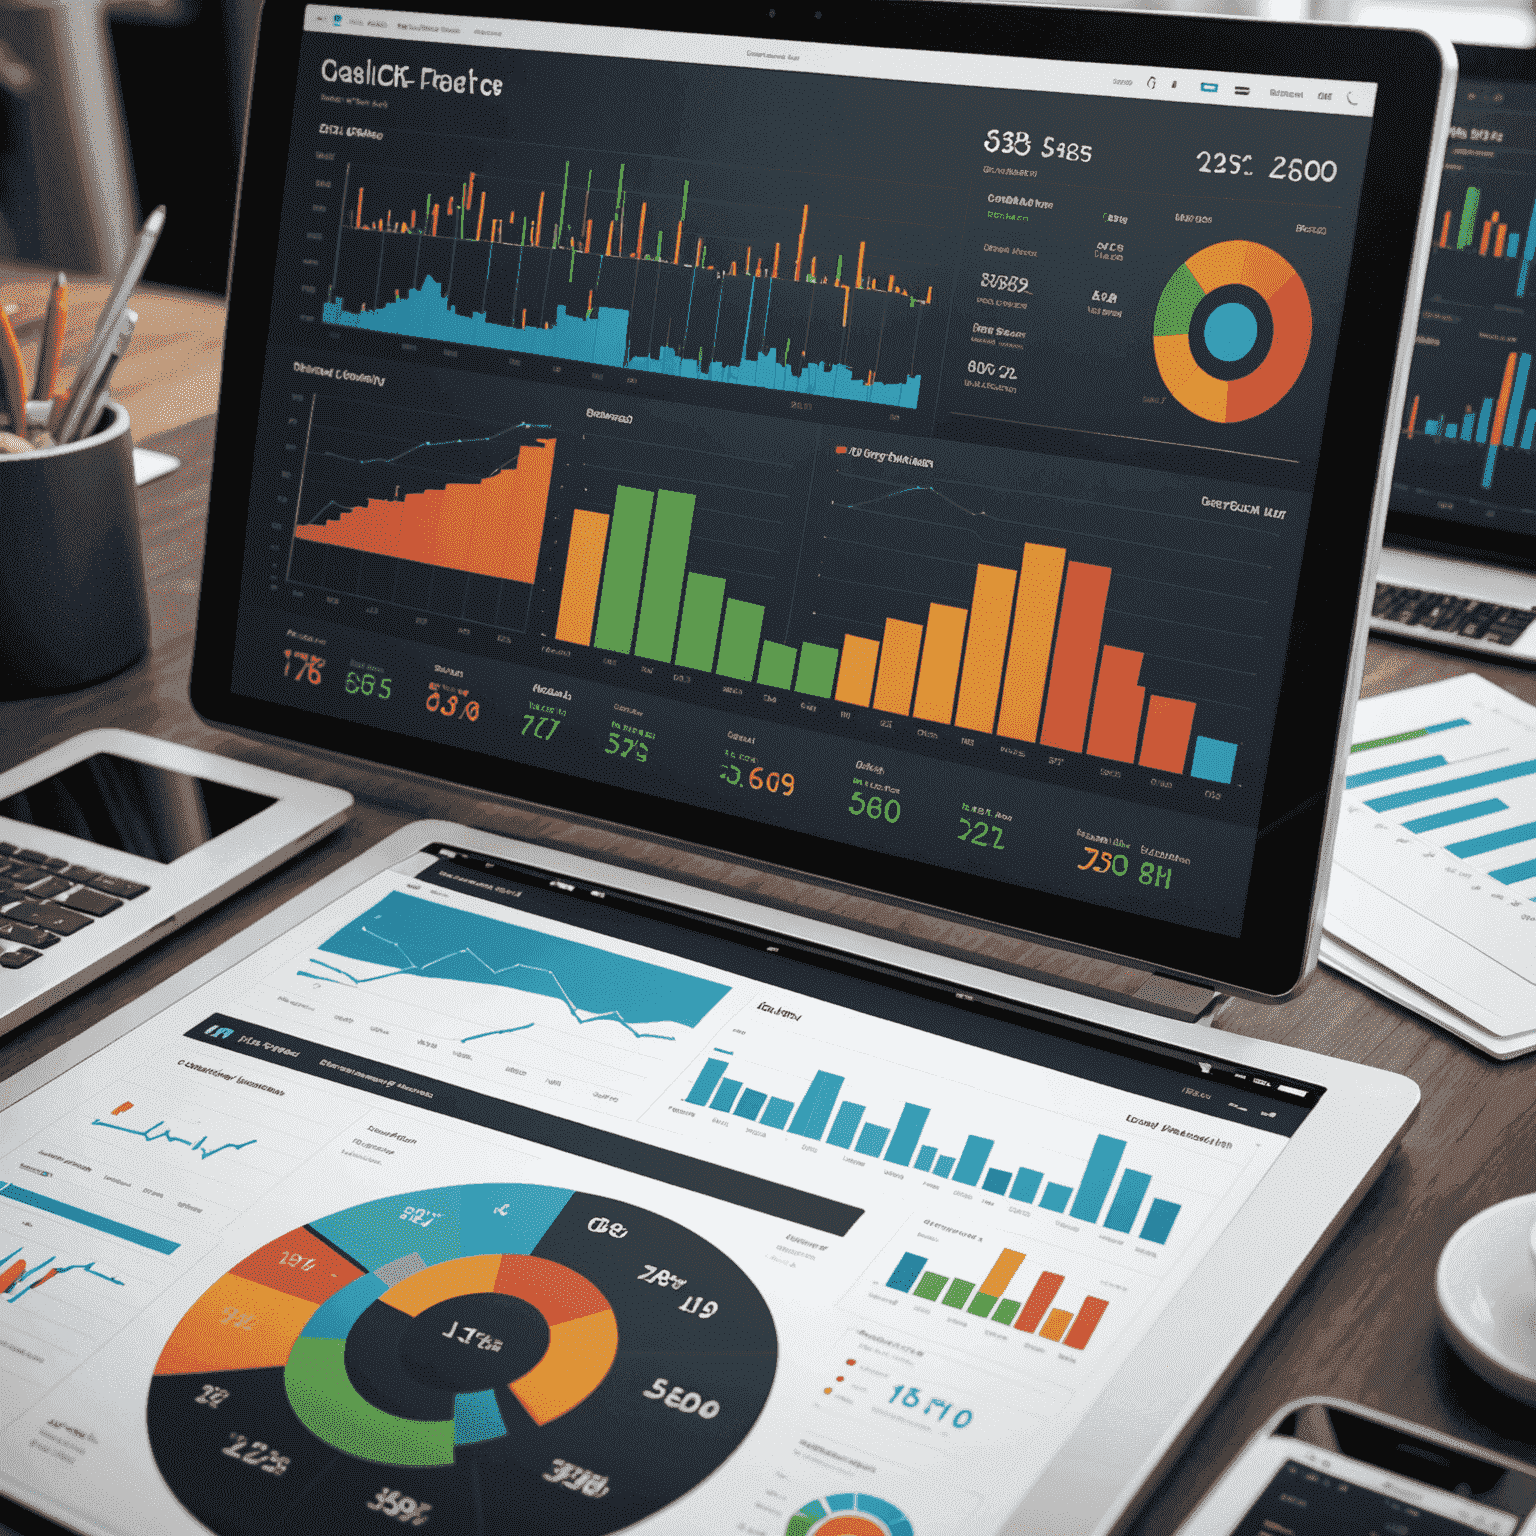
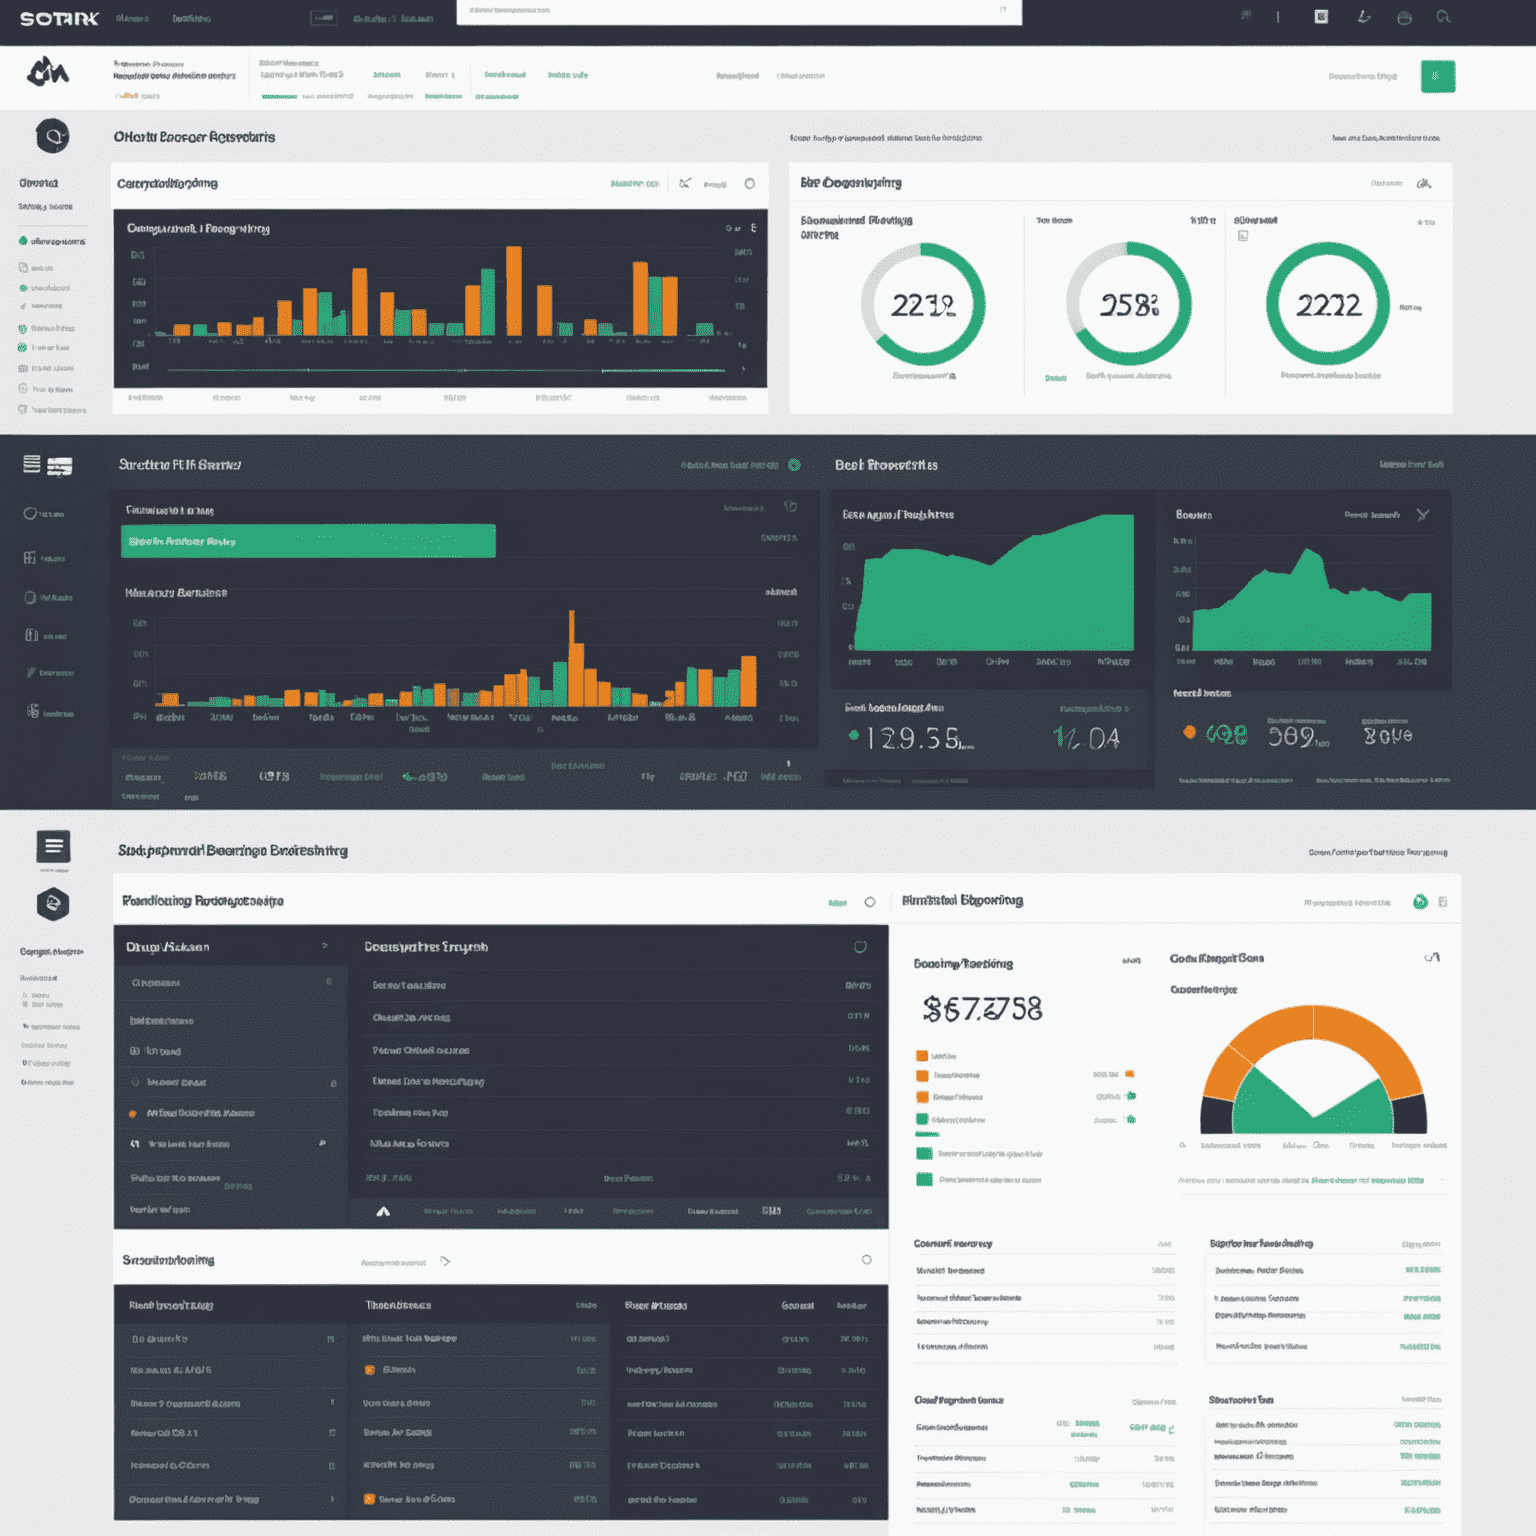
Our team of expert web design developers created a state-of-the-art financial dashboard that included:
- Real-time stock performance tracking with predictive analytics
- Interactive profit and loss statements with drill-down capabilities
- Cash flow visualization with forecasting models
- Customizable KPI widgets for different departments and roles
- Geospatial mapping of global financial operations
- AI-powered anomaly detection for early risk identification
The Results
The implementation of our custom financial dashboard yielded significant benefits for the client:
- 50% reduction in time spent on financial reporting and analysis
- 30% improvement in forecast accuracy
- Increased stakeholder confidence due to real-time data accessibility
- Enhanced collaboration between accounting, operations, and executive teams
- Ability to identify and respond to market trends more quickly
"FirstLedger's financial dashboard has revolutionized how we view and interact with our financial data. It's not just a visualization tool; it's become an integral part of our strategic decision-making process."
Conclusion
This case study demonstrates FirstLedger Web App Data Visualization Development Studio's capability to deliver high-impact solutions in web data visualization development. By combining our expertise in data dashboard development with a deep understanding of financial processes, we were able to create a tool that not only met but exceeded our client's expectations, driving tangible improvements in their financial operations and decision-making capabilities.
Are you looking to transform your financial data into actionable insights? Contact FirstLedger Web App Data Visualization Development Studio today to explore how we can develop a custom web data visualization solution tailored to your organization's needs.